Correlation tables and IHD
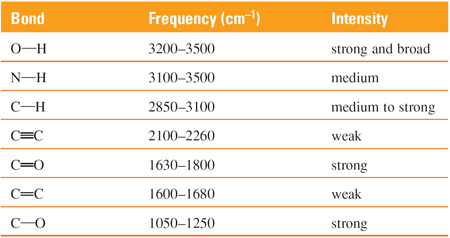
Infrared absorption data are listed in correlation tables by frequency and intensity. Individual absorption frequencies are listed together with characteristic absorption frequencies for compounds of the same type; for example, alkanes, alkenes and alkynes. For example, an O–H absorption is listed as a strong band over the range 3200 to 3500 cm−1 and the characteristic bands of alkenes are C–H, medium, 3000–3100 cm−1; C=C, medium 1600–1680 cm−1.
For unsaturated hydrocarbons, particularly arenes, prior determination of the index of hydrogen deficiency (IHD) is useful in the interpretation of infrared spectra. The IHD is the sum of the number of rings and π bonds in a molecule. For a hydrocarbon, the IHD is determined by comparing the number of hydrogen atoms in the molecular formula of an unknown structure with the number of hydrogen atoms in a reference compound with the same number of carbon atoms, but with no rings or π bonds present.